2024-2025 SUBMERGED
Robot History
Blue Whale (v1)
First Design - May 2024
Two small motors for attachments. Found to be too large and inefficient for cross-field missions.
Blue Scorpion (v2)
Second Design - July 2024
Four-output system with switching motor. Innovative but switching caused inaccuracy.
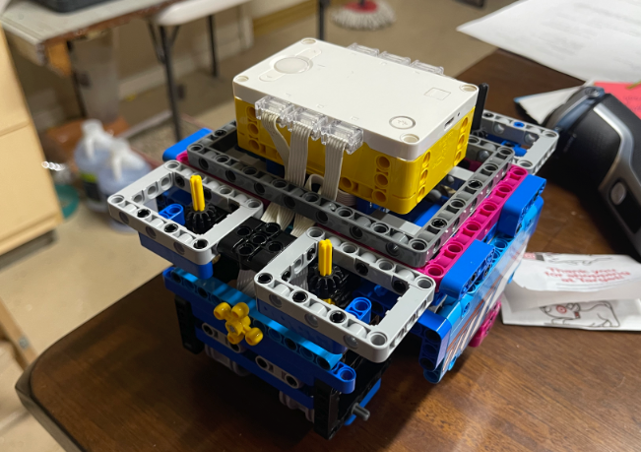
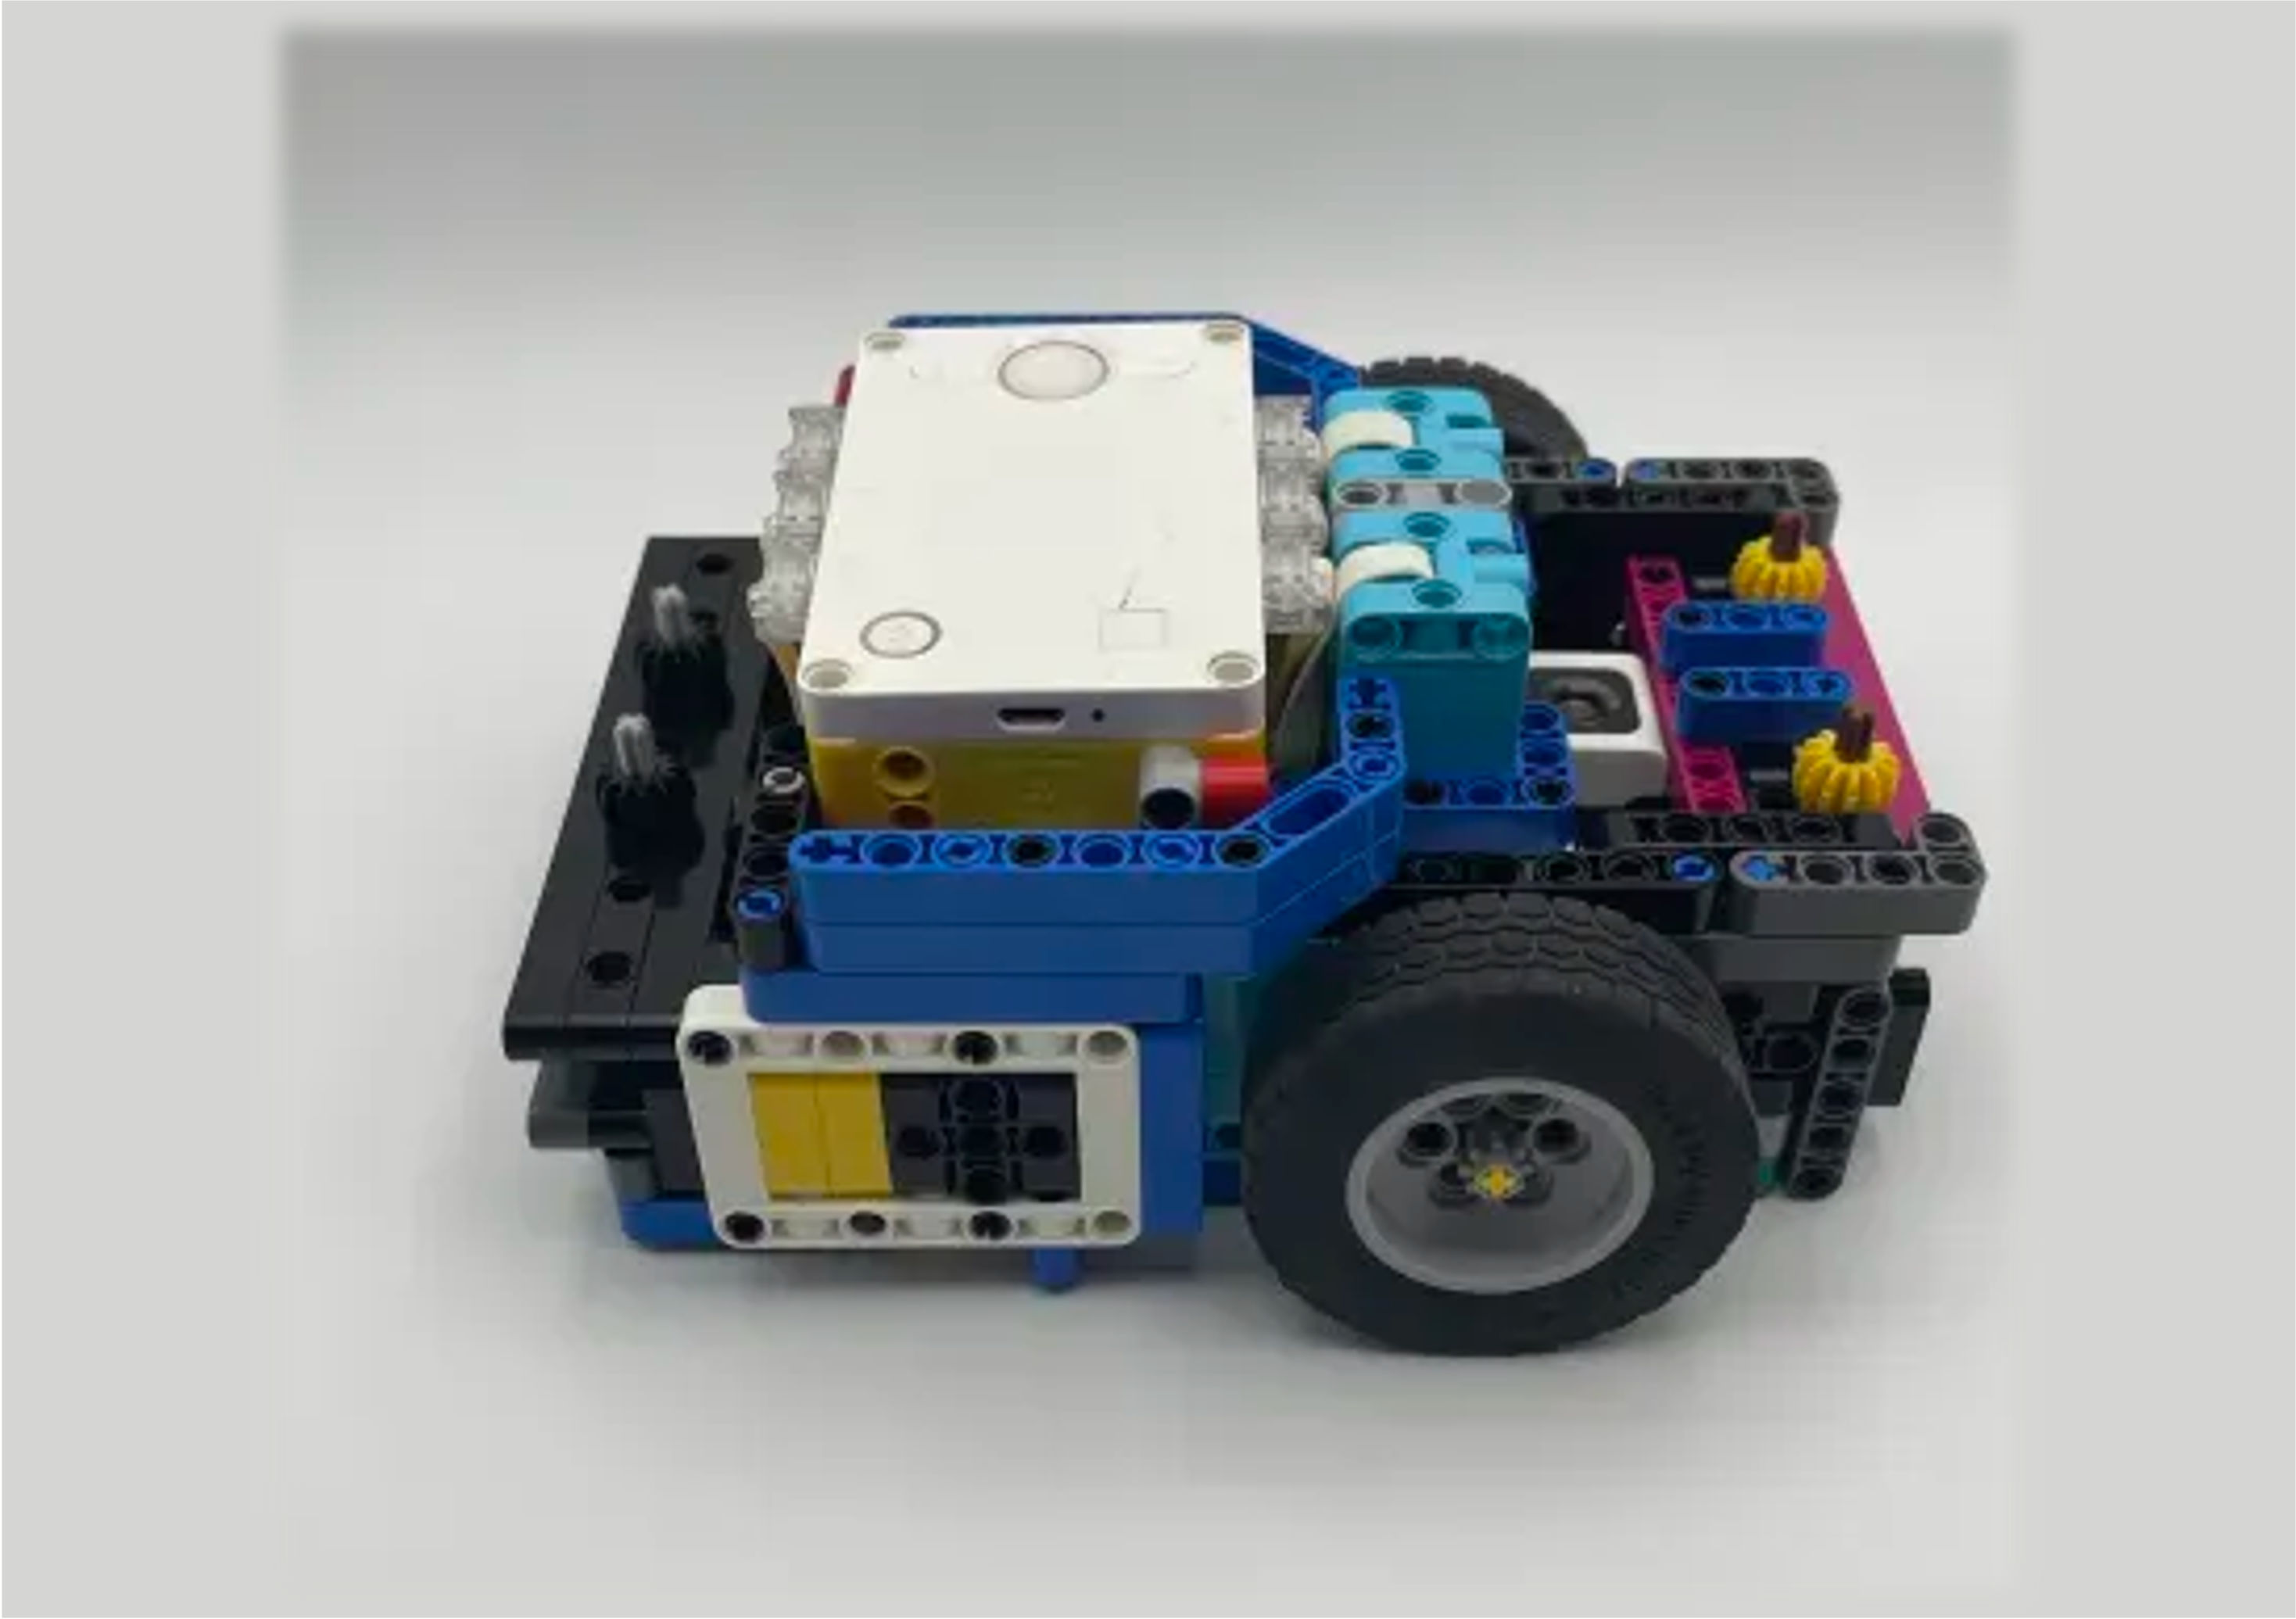
Cyber Truck (v3)
Third Design - July 2024
Soft EV3 wheels for traction, 3 balancers, light sensors for auto-switching programs.
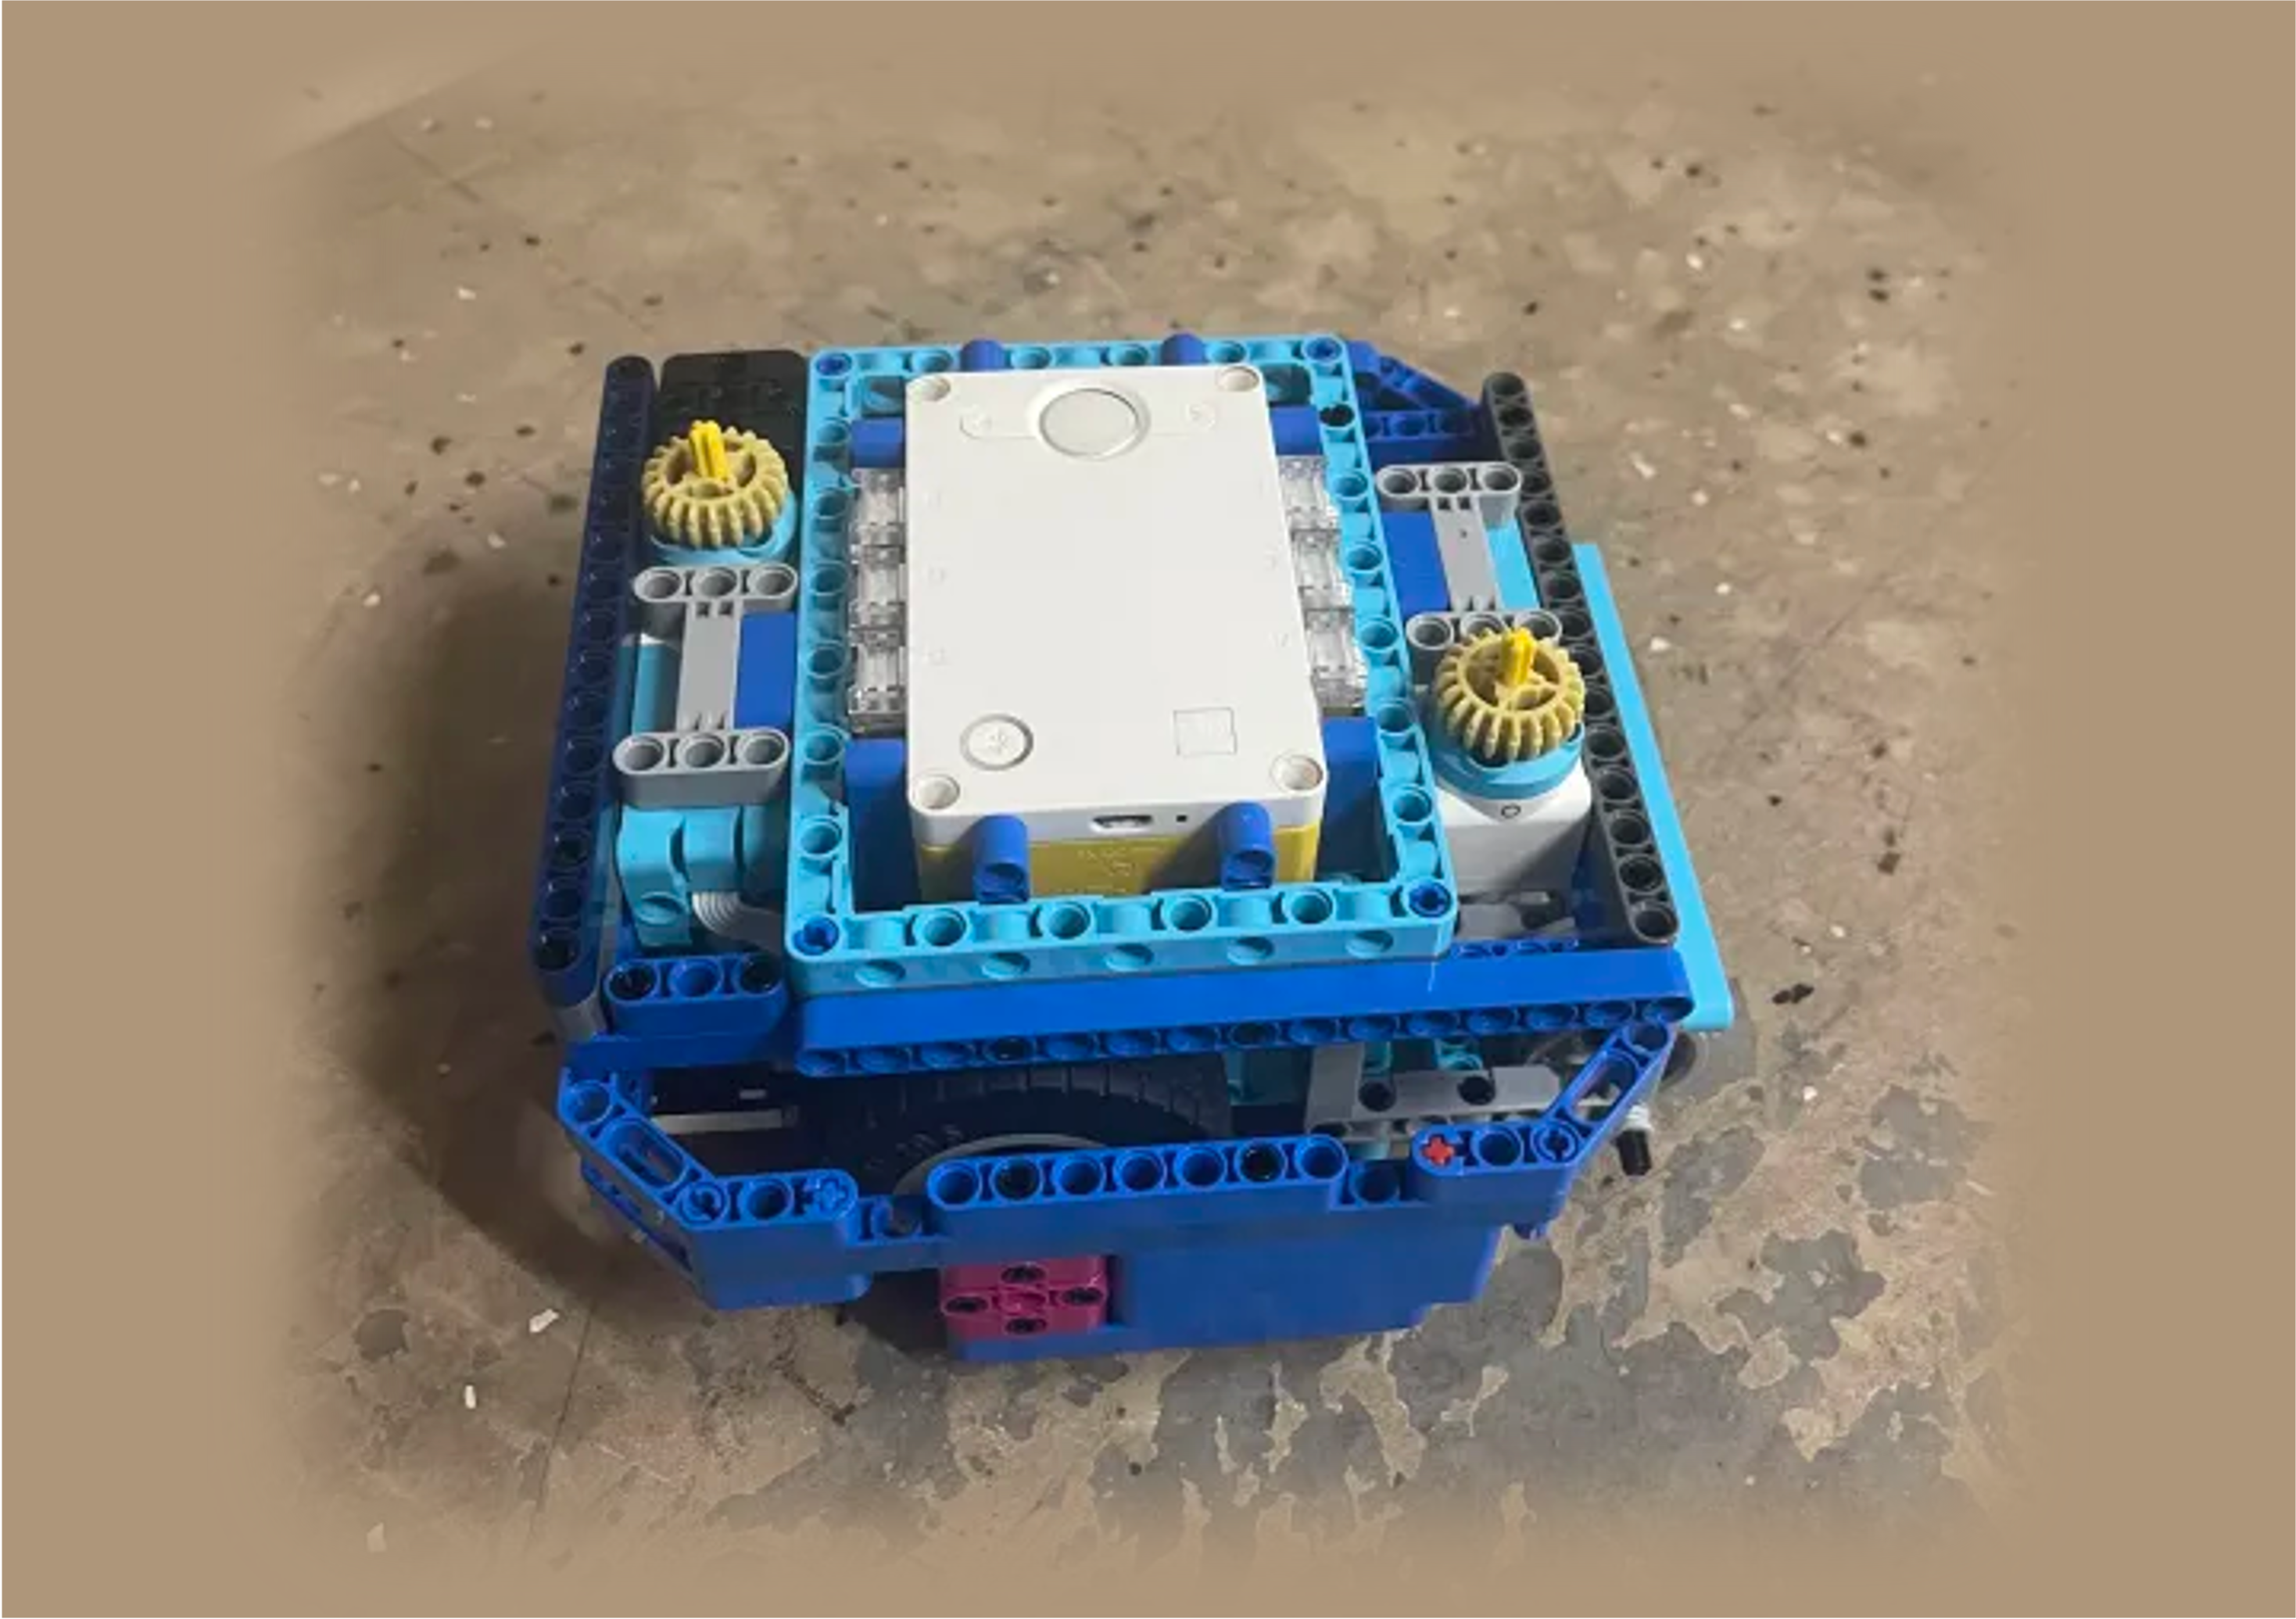
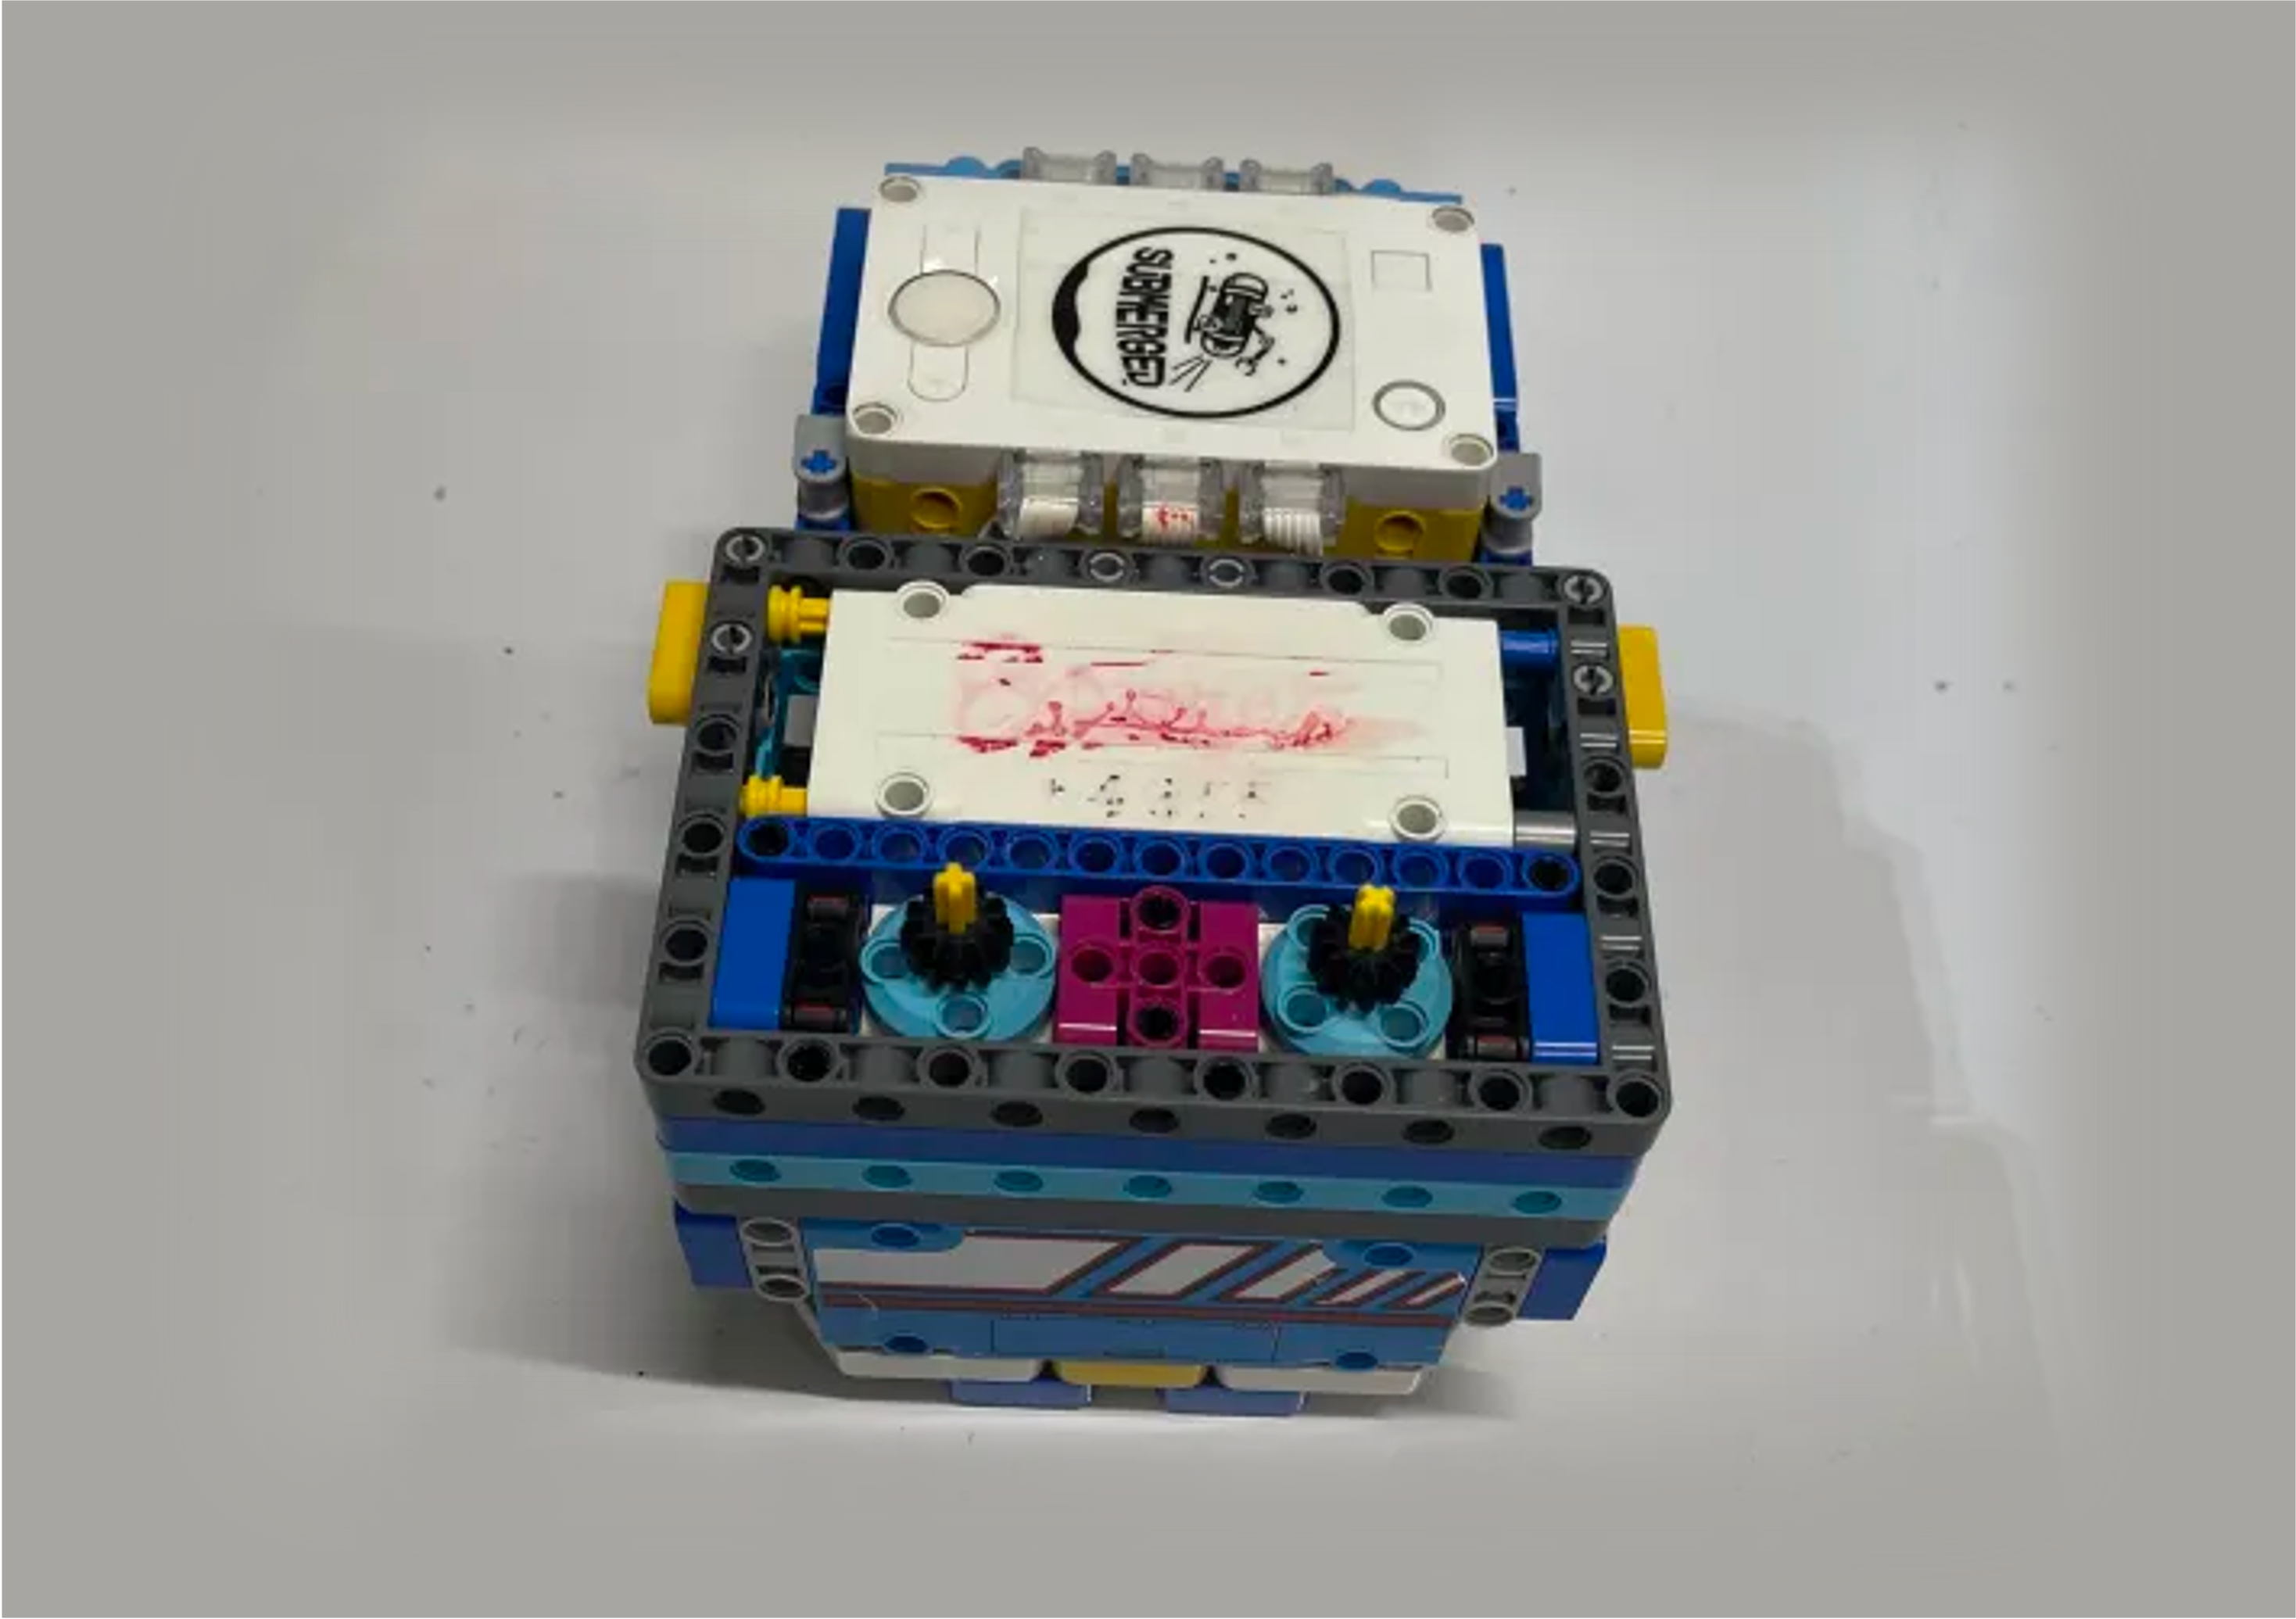
Black Panther (Final)
Final Design - July 2025
Four linked motors for simultaneous operations. Strategic mounting points. Our best robot yet.
Mission Strategy
Key insights after analyzing the game rules:
- 🌊 Priority A: Collect Reef Segments, Krill, Water Sample first (they block paths).
- 🐋 Priority B: Feed the Whale (M12) only after collecting 5 krill.
- 🧪 Priority C: Sample Collection (M14) before Research Vessel.
- 🚢 Priority D: Send Submersible as late as possible (closer to opponent).
Strategy Evolution
v0: Exploration
Get familiar with missions. Score: ~480. No time limit focus.
v1: Combination
Combine missions. Max score focus. 8 separate runs (inefficient). Score potential high, but time issue.
v2: Optimization
Fewer runs. Improved efficiency. Score: 535. Completed most missions.
v3: Python & Speed
Using Pybricks (Python). strict "5 pts/sec" rule. Goal: 620 points.
Testing Results
Run Strategy Comparison
| Run # | V1 | V2 | V3 (Python) |
|---|---|---|---|
| Max Score | 370 | 565 | 620 |
* Detailed run breakdown available in internal documentation.